Multiple Choice
Identify the
choice that best completes the statement or answers the question.
|
|
|
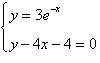
1.
|
Solve the system by the method of
substitution.

a. | (4, 3) | b. | (4, –3) | c. | (3,
4) | d. | (–3, 4) | e. | (–4, 3) |
|
|
|
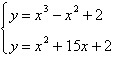
2.
|
Solve the system by the method of
substitution.

a. | (–4, –23), (5,
–14) | b. | no real
solution | c. | (–4, –25) | d. | (–4, –25), (5, –16) | e. | (–4, 15), (5, 24) |
|
|
|
3.
|
Use a graphing utility to solve the system of
equations. Find the solution accurate to two decimal places.
a. |  | b. |  | c. |  | d. |  | e. | no real solution |
|
|
|
4.
|
Solve the system by the method of
substitution.
a. | (5, 102), (3, 56), (1, 18) | b. | (5, 102), (–1, –12) | c. | (–3, –34), (1, 18) | d. | (5, 102), (–3, –34), (0, 2) | e. | no real solution |
|
|
|
5.
|
Find the sales necessary to break even (R
– C = 0) for the cost C of producing x units and the revenue R
obtained by selling x units. (Round to the nearest whole unit.)
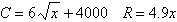
a. | 782 units or 852 units | b. | no real solution | c. | 852
units | d. | 782 units | e. | 831 units |
|
|
|
6.
|
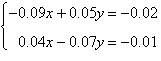
Solve the system by the method of
elimination.
a. |  | b. |  (dependent) (dependent) | c. |  | d. |  | e. | inconsistent |
|
|
|
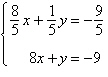
7.
|
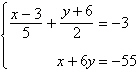
Solve the system by the method of
elimination.
|
|
|
8.
|
Solve the system by the method of
elimination.
|
|
|
9.
|
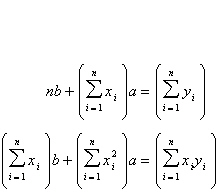
Find the least squares regression line  for the points for the points
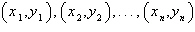
by solving the system for a and
b.
Points:  space space
a. | y = –3.47x
–4.21 | b. | y =
3.93x –4.21 | c. | y =
2.80x –3.20 | d. | y =
–2.66x +2.80 | e. | y =
–3.20x +2.80 |
|
|
|
10.
|
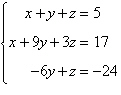
Solve the system of linear equations.
|
|
|
11.
|
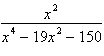
Write the form of the partial fraction
decomposition of the rational expression. Do not solve for the constants.

|
|
|
12.
|
Write the partial fraction decomposition of the
rational expression.

|
|
|
13.
|
Write the partial fraction decomposition of the
rational expression.
|
|
|
14.
|
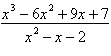
Write the partial fraction decomposition of the
improper rational expression.
|
|
|
15.
|
Use a graphing utility to graph the inequality.
Shade the region representing the solution.

|
|
|
16.
|
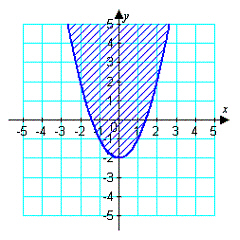
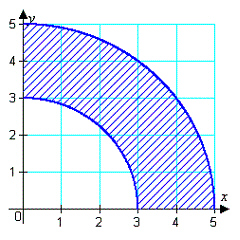
Write an inequality for the shaded region shown in
the figure.
|
|
|
17.
|
Sketch the graph and label the vertices of the
solution set of the system of inequalities. Shade the solution set.

|
|
|
18.
|
Derive a set of inequalities to describe the
region.
|
|
|
19.
|
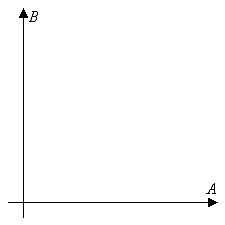
Find the minimum and maximum values of the
objective function and where they occur, subject to the indicated constraints.
| Objective function: | | | | | Constraints: | | | | | |
|
|
|
20.
|
An investor has $150,000 to invest in two types of
investments. Type A pays 5% annually and type B pays 6% annually. To have a well-balanced portfolio,
the investor imposes the following conditions. At least one-third of the total portfolio is to be
allocated to type A investments and at least one-third of the portfolio is to be allocated to type B
investments. What is the optimal amount that should be invested in each investment?
a. | $150,000 in type A (5%), $0 in type B
(6%) | b. | $50,000 in type A (5%), $100,000 in type B
(6%) | c. | $100,000 in type A (5%), $50,000 in type B
(6%) | d. | $0 in type A (5%), $150,000 in type B
(6%) | e. | $60,000 in type A (5%), $90,000 in type B
(6%) |
|