Multiple Choice
Identify the
choice that best completes the statement or answers the question.
|
|
|
1.
|
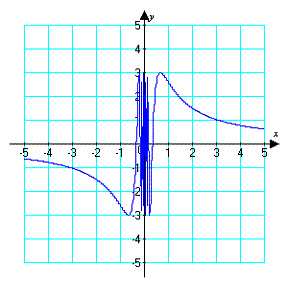
Select the correct graph for the following function
using a graphing utility.

|
|
|
2.
|
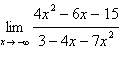
Use the given information to evaluate the
limit.


a. |  –66
–66 | b. |  11
11 | c. |  –65
–65 | d. |  –64
–64 | e. |  –6
–6 |
|
|
|
3.
|
Find the limit by direct substitution.

|
|
|
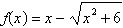
4.
|
Find the limit by direct substitution. Round your
answer to two decimal places.

a. |  =
8103.08 =
8103.08 | b. |  =
2.72 =
2.72 | c. |  = =  | d. |  = 20.09
 | e. |  =
–20.09 =
–20.09 |
|
|
|
5.
|
Complete the table and use the result to
estimate numerically. numerically.
x | –7.1 | –7.01 | –7.001 | –7 | –6.999 | –6.99 | –6.9 | f(x) | | | | ? | | | | | | | | | | | |
a. |  | b. | –11 | c. | 11 | d. | ¥ | e. | limit does not
exist |
|
|
|
6.
|
Use the graph to find

a. | limit does not exist | b. | 3 | c. | ¥ | d. |  | e. | 0 |
|
|
|
7.
|
Use the limit process
to find the slope of the graph of the function at the specified point. Use a graphing utility to
confirm your result.
|
|
|
8.
|
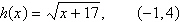
Find a formula for the
slope of the graph of  at the point at the point  . Then use it
to find the slope at the given point. . Then use it
to find the slope at the given point.
|
|
|
9.
|
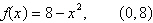
Select a graph of the
function and the tangent line at the point  . .

|
|
|
10.
|
Find the derivative of
the function.

|
|
|
11.
|
Find the limit (if it exists).

a. | 12 | b. | 7 | c. | –7 | d. | 5 | e. | Does not
exist |
|
|
|
12.
|
Find the limit (if it exists).

a. |  | b. |  | c. | – | d. | – | e. | Does not exist |
|
|
|
13.
|
Find the limit (if it exists).
a. |  | b. | – | c. |  | d. | – | e. | Does not exist |
|
|
|
14.
|
Find the first five terms of the
sequence.

a. |   , ,   , ,   , ,   , ,   | b. |   , ,   , ,   , ,   , ,   | c. |   , ,   , ,   , ,   , ,   | d. |   , ,   , ,   , ,   , ,   | e. |   , ,   , ,   , ,   , ,   |
|
|
|
15.
|
Complete the table and numerically estimate the
limit as x approaches infinity for the following function.
Select the correct
answer.
|
|
|
16.
|
|
|
|
17.
|
Complete the table using the function  , over the specified interval , over the specified interval  to approximate the area of the region bounded
by the graph of to approximate the area of the region bounded
by the graph of  , the x-axis, and the vertical lines , the x-axis, and the vertical lines
 and and  using the
indicated number of rectangles. Then find the exact area as using the
indicated number of rectangles. Then find the exact area as  . .
| n | 4 | 8 | 20 | 50 | 100 | | | Approximate area | | | | | | | | | | | | | |
(Round the answer to two decimal places.)
|
|
|
18.
|
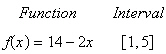
Use the limit process to find the area of the
region between the graph of the function and the
x-axis over the specified
interval.
|
|
|
19.
|
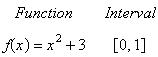
Use the limit process to find the area of the
region between the graph of the function and the
x-axis over the specified
interval.
|
|
|
20.
|
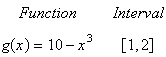
Use the limit process to find the area of the
region between  and the x-axis on the interval and the x-axis on the interval  . .
a. | 228 | b. | 108 | c. | 180 | d. | 408 | e. | 188 |
|