|
|
|
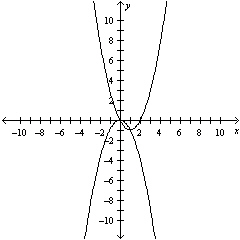
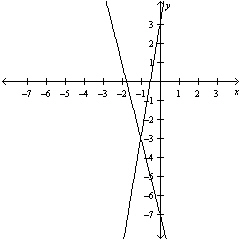
1.
|
Solve the system by the method of substitution.
Check your solution(s) graphically.
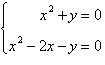
a. | (0, 0), (1, –1) | b. | (0, 0), (1, 1) | c. | (0, 0), (–1,
–1) | d. | (0, 1), (0, –1) | e. | (1, 0), (0, –1) |
|
|
|
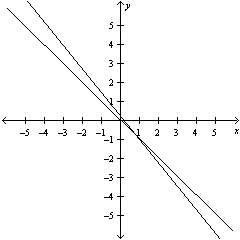
2.
|
Use a graphing utility to solve the system of
equations. Find the solution accurate to two decimal places.
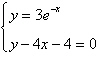
a. |  | b. |  | c. |  | d. | no real solution | e. |  |
|
|
|
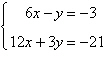
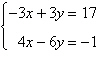
3.
|
Use any method to solve the system.

|
|
|
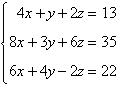
4.
|
Solve the system by the method of
elimination.
|
|
|
5.
|
Solve the system by the method of
elimination.

|
|
|
6.
|
Solve using any method.
|
|
|
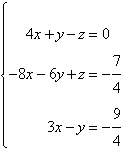
7.
|
Determine whether the ordered triple is a solution
of the system of equations.

|
|
|
8.
|
In Super Bowl I, on January 15, 1967, the Green Bay
Packers defeated the Kansas City Chiefs by a score of 15 to 30 . The total points scored came
from 13 different scoring plays, which were a combination of touchdowns, extra-point kicks, and field
goals, worth 6, 1, and 3 points, respectively. The same number of touchdowns and extra-point kicks
were scored. There were six times as many touchdowns as field goals. How many touchdowns, extra-point
kicks, and field goals were scored during the game?
a. | 6 touchdowns, 6 extra-point kicks,1 field
goal | b. | 6 touchdowns, 1 extra-point kick, 1 field
goal | c. | 6 touchdowns, 6 extra-point kicks, 6 field
goal | d. | 1 touchdown, 6 extra-point kicks, 1 field
goal | e. | 1 touchdown, 6 extra-point kicks, 6 field
goal |
|
|
|
9.
|
Determine which one of the ordered triples below is
a solution of the given system of equations.
|
|
|
10.
|
Write the form of the partial fraction
decomposition of the rational expression. Do not solve for the constants.

|
|
|
11.
|
The predicted cost C (in thousands of
dollars) for a company to remove  of a chemical from its waste water is
given by the model of a chemical from its waste water is
given by the model
 . .
Write the partial fraction
decomposition for the rational function. Verify your result by using the table feature of a
graphing utility to create a table comparing the original function with the partial
fractions.
|
|
|
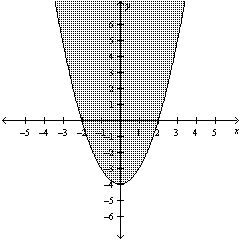
12.
|
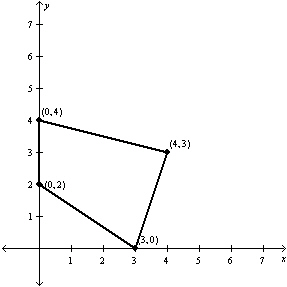
Select an inequality for the shaded region shown in
the figure.
|
|
|
13.
|
Find the consumer surplus and producer
surplus.
Demand 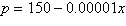
Supply 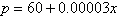
|
|
|
14.
|
Use a graphing utility to graph the
inequality.

|
|
|
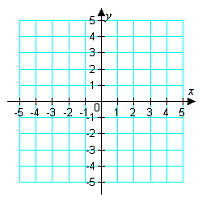
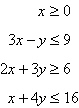
15.
|
Sketch the graph and label the vertices of the
solution set of the system of inequalities. Shade the solution set.

|
|
|
16.
|
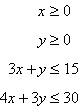
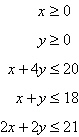
Find the minimum value of the objective function
and where they occur, subject to the indicated constraints.
Objective function:

Constraints:
a. | Minimum at  | b. | Minimum at  | c. | Minimum at  | d. | Minimum at  | e. | Minimum at  |
|
|
|
17.
|
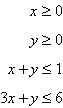
Find the minimum value of the objective function
and where they occur, subject to the constraints:
Objective function:

Constraints:
a. | Minimum at  | b. | Minimum at  | c. | Minimum at  | d. | Minimum at  | e. | Minimum at  |
|
|
|
18.
|
Find the minimum value of the objective function
and where they occur, subject to the constraints:
Objective function:

Constraints:
a. | Minimum at  | b. | Minimum at  | c. | Minimum at  | d. | Minimum at  | e. | No minimum |
|
|
|
19.
|
The linear programming problem has an unusual
characteristic. Select a graph of the solution region for the problem and describe the unusual
characteristic. Find the maximum value of the objective function (if possible) and where they
occur.

Constraints:
|
|
|
20.
|
Find the minimum and maximum values of the
objective function and where they occur, subject to the indicated constraints.
| Objective function: | | | | | Constraints: | | | | | |
|